I did a bit of analysis on a set of data in the new Annual Energy Review 2008 (released June 2009). The Review is created by the Energy Information Administration (EIA) – the statistical agency of the US Department of Energy.
Although there is a lot of information about energy production and consumption in this report, I want to write a bit more about CO2 release in China and the USA. I mentioned last post that the US and China are jointly responsible for 40% of the world’s CO2 emissions. I did a bit of analysis on the emissions numbers and came up with some interesting results.
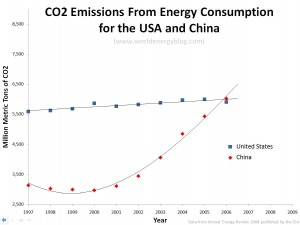
- 2006 was the first year that Chinese CO2 emissions were greater than US emissions. 2006 is the most recent data available because it’s complicated to calculate how much CO2 an entire country emits.
- US emissions are increasing by approximately 40 million metric tons every year (less than 1% increase per year). That’s about half of Romania’s total emissions every year.
- China’s emissions are increasing by approximately 550 million metric tons every year (nearly 10% increase per year!). That’s all of the UK’s emissions.
- So every year, the US emits about half-a-Romania more than it did the year before and China emits a whole United Kingdom more than it did the year before. China is growing quickly and emitting a lot more CO2 as a result.
I whipped up the graph below (click on it) to show US and Chinese emissions over the last few years. I added some trend-lines to the data so that it’s clear exactly what’s happened over the last few years.
Try to see if you can guess, based on the last few years data, how much the USA and China will emit in 2009. From the graph, I estimate that China will emit between 7,300 and 8,300 million metric tons of CO2 in 2009. The US won’t even break 6,500 million metric tons of CO2 by then.
So China is growing out of control? Yes and no.
China should definitely work on slowing their CO2 emission rate as their country continues to develop. But there’s another side to these emissions numbers. These numbers are for the entire country. Let’s take a look at the emissions per person.
In 2006, China had approximately 1.31 billion people. The US had approximately 298 million people. So China has over 4 times as many people as the US does. That means that the average American released 4 times as much CO2 as the average Chinese citizen in 2006. That fact makes it a bit harder to ask the Chinese to reduce their emissions if the US won’t do the same.
Bottom Line: If you think that China’s emissions are growing out of control, then it’s pretty clear that US emissions have been out of control for decades.


